Everyone needs a plan or we would never know where we were, where we are going or when we arrived!
Making Reactive Work History
When Operations and Production are in a Reactive loop it's hard to see a way out.
I can empathise as I have experienced that situation and it's a painful path for all.
I can empathise as I have experienced that situation and it's a painful path for all.
Where do you start if you have had enough?
Well, you have to realise that you are where you are and that it's not a good place to be. Some though have addictive traits when it comes to working reactively, they like the challenge, enjoy saving the day, happily busy with 'real work' or they are so conditioned that they don't see it being an issue!
Many organisations consider Maintenance as an overhead cost rather than an enabler, this is understandable if the maintenance consists of sticking things back together until they break again. I view maintenance as an enabler, it maintains assets so that they are available for operations, in a proactive and predictive strategy it adds value, by reducing reactive interventions it enhances safety, parts procurement is reduced, labour is less stretched, there are multiple benefits as you can see.
Many organisations consider Maintenance as an overhead cost rather than an enabler, this is understandable if the maintenance consists of sticking things back together until they break again. I view maintenance as an enabler, it maintains assets so that they are available for operations, in a proactive and predictive strategy it adds value, by reducing reactive interventions it enhances safety, parts procurement is reduced, labour is less stretched, there are multiple benefits as you can see.
Why the reticence or resistance to change?
I believe it can be due to a few things depending on how the organisation is set up, here's my short list:
Comfort: many people just don't like change, they thrive on regularity, change can be painful for them.
The status quo is comfortable for a lot of people.
Habit: they say habits take time and repetition to take hold, once they set in they are hard to change and you need to 'relearn' new habits that takes precious time. Some studies say it takes on average 66 days to form a habit, others say it can range from 18 to 250 days, so it requires a few months just to 'turn on' new habits let alone break the old ones.
Ignorance: this could be unconscious or conscious, training and development will be required to enlighten all. If you are always used to chaos then it becomes normal to work like that, you are not aware of a different place of operation.
Time: constrained by 'busy-ness' the available time is devoured by fire fighting and constant emergency work execution. Time is finite for us all not just in life itself but when we are manufacturing products. When I see the recovery after a reactive event I always think about the time that has past, it's unretrievable and gone forever.
People: resistance to change, ageing skilled workforce, turnover, lack of focus, rewards for heroes, management, lack of ownership, motivation, stress, availability, all play a major role in any change process.
Revenue: another constraint every business has, shrinking budgets allow little room for development, heavier loads of reactive work increasing the maintenance spend which in turn reduces resource.
Whilst a lot of people like to talk about the 'tools' to transition from Reactive to a Proactive and Predictive function we can see from the above it's mainly about the people in an organisation.
Let's take a look at what I believe might be ways to address them
The first three, Comfort, Habit and Ignorance kind of fit together for me and are the starting point for change. This is the 'big sell' from whoever is the catalyst in the organisation to inform Operations, Production and Engineering that it is going to change. Inform everyone that this is a journey, the early part may be uncomfortable, there will be wins and set backs, habits will have to be relearnt and development with training will become the new normal.
Time, People and Revenue are the three main constraints I always talk about, these are interlocked and finite, you can hire more people but not without expending the other two. There are only so many hours in the day and only so much money in the pot. Measurement is going to play an important part here as we need to find out where we actually are (not where we think we are), how much time money and labour is being expended and where is a good start.
On the people front we are all getting older, in the UK there's a whole generation of experienced engineers approaching retirement and whilst I have met some really great talent in the next cohort they are much lighter on the ground. Gone are the days where you specialised in one area that lasted a career, engineers in their 20s and 30s will need to adapt quicker and more often throughout their working life, training will have to be ongoing.
This is near impossible in a Reactive environment so even more important to get it under control
There's a lot of noise around at the moment about the Industrial Internet of Things (IIoT) and whilst I'm a big fan of these developments it will still require people with different mindsets and skills to navigate the ideal course for their business. It will not provide a silver bullet to jump from Reactive to Prognostic, it will require time people and resources. The reality is that those that start first with IIoT maybe able to steal a march on the competition, it is almost impossible to do this from a Reactive stance, you need to be in control first.
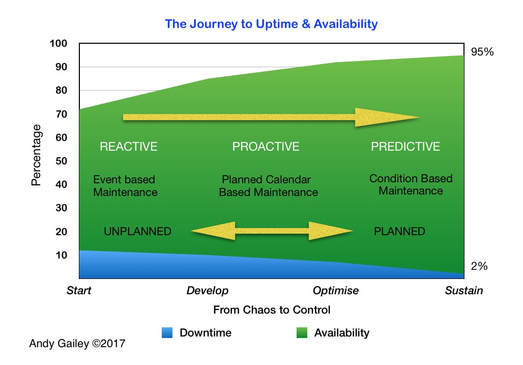
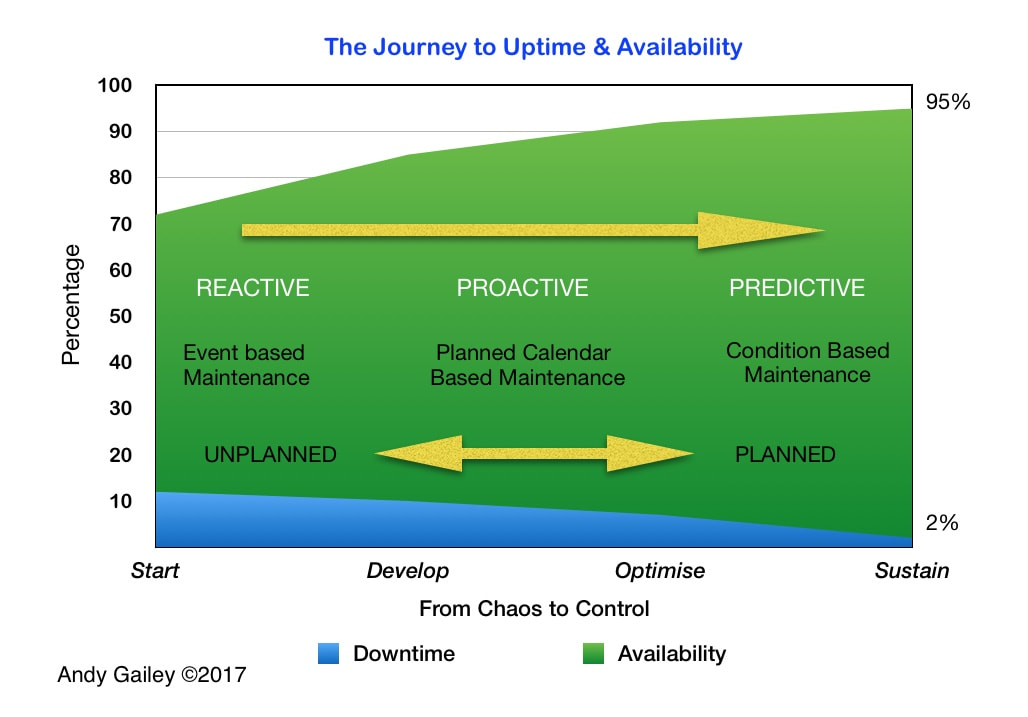
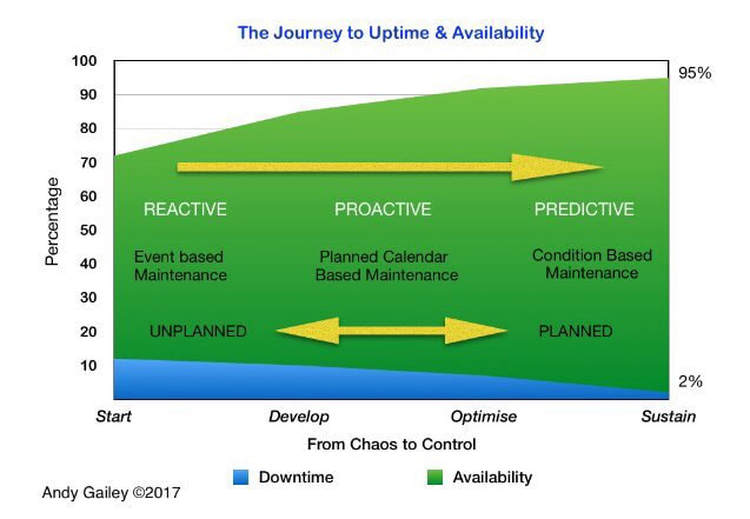
This Uptime Consultant graphic describes a real journey from a Reactive state through the Proactive and Predictive phases, the time frame is about 4-5 years and was achieved through the right leadership, a vision, change in mindset and input from cross functional teams to get to less than 2% unplanned downtime and +95% availability.
I started with the title 'Making Reactive Work History' and like most of my articles have free styled off point, but that's the beauty of this for me, I mind dump these articles in about 30 minutes then spend a couple of hours fettling, spell checking and proofing before publishing.
Please let me know your experiences, comment, like or share this article. If you want to chat about your challenges contact me at [email protected]
Recognising the Reactive Cycle: Part 1 of 3
Part 1 in a trilogy of articles collectively called "From Reactive to Innovative"
When engaged in the day to day business cycle of Production it can be hard to find the time to step back and focus on the Process.
Operations can become used to recording costs of waste, labour, rework or maintenance.
Even if you know you are operating Reactively it takes courage to stop and confront it.
The issue is that people see it as a 'failure' if you realise your inefficiencies and have to change course, but it shouldn't be this way.
Change and adopting new practices is how the top companies and corporations keep ahead of the pack, you change or die in some businesses.
My interest at Uptime Consultant is with the overall efficiency of any given Process, the impact of lost availability due to planned or unplanned downtime. In this first article I focus on:
Part two: the second article will consider how to move towards a Proactive phase.
Part three: explores entering the Predictive phase with an eye on Innovation.
I say phase because it's a journey from a Reactive state through Proactive to Predictive with the end goal of Innovative.
It can be done, I know because I have been there and witnessed it.
Here are my 10 key indicators of a Reactive process, see if you recognise any of the following they are a sure sign, there are many more but these are my top picks:
Excessive WIP
Operations that hold WIP usually act like this because they require a 'buffer' to mitigate a future line stoppage that they may know is going to occur.
If you rely on WIP to function and service your customer then it's a sign of a reactive cycle.
High levels of parts held in stores
Take a look at the parts inventory and then take time to ask why?
Why are there so many of that particular bearing in stock?
You may find out that it's a 'fast mover' for an asset that repeatedly breaks down. Ideally all parts would be sitting on a suppliers stock shelf until it's required, unfortunately poor reliability could be driving the stock purchase.
This is another sure sign of a reactive operation.
Planned Maintenance (PM) carried out on failing assets
This is a classic scenario that is often the case in some operations.
You can see a PM activity that may have been instigated some years ago and 'developed' over years into a massive weight around the maintenance function.
These if allowed to grow over time add more PMs, this strains already stretched labour resources on equipment that still breaks down.
Why would you do this? Would you do it with your car? Another sure sign of a reactive process.
Operations can become used to recording costs of waste, labour, rework or maintenance.
Even if you know you are operating Reactively it takes courage to stop and confront it.
The issue is that people see it as a 'failure' if you realise your inefficiencies and have to change course, but it shouldn't be this way.
Change and adopting new practices is how the top companies and corporations keep ahead of the pack, you change or die in some businesses.
My interest at Uptime Consultant is with the overall efficiency of any given Process, the impact of lost availability due to planned or unplanned downtime. In this first article I focus on:
- What does a Reactive operation look like?
- What are some of the key indicators?
Part two: the second article will consider how to move towards a Proactive phase.
Part three: explores entering the Predictive phase with an eye on Innovation.
I say phase because it's a journey from a Reactive state through Proactive to Predictive with the end goal of Innovative.
It can be done, I know because I have been there and witnessed it.
Here are my 10 key indicators of a Reactive process, see if you recognise any of the following they are a sure sign, there are many more but these are my top picks:
- Excessive Work In Progress (WIP)
- High levels of parts held in stores
- Planned Maintenance carried out on failing assets
- Reactive Labour and Firefighting
- Production losses due to Downtime
- Emergency orders and specials
- Overtime work on breakdowns
- Ad hoc Permits To Work
- Accidents and Near Misses
- Dis-organised working areas
Excessive WIP
Operations that hold WIP usually act like this because they require a 'buffer' to mitigate a future line stoppage that they may know is going to occur.
If you rely on WIP to function and service your customer then it's a sign of a reactive cycle.
High levels of parts held in stores
Take a look at the parts inventory and then take time to ask why?
Why are there so many of that particular bearing in stock?
You may find out that it's a 'fast mover' for an asset that repeatedly breaks down. Ideally all parts would be sitting on a suppliers stock shelf until it's required, unfortunately poor reliability could be driving the stock purchase.
This is another sure sign of a reactive operation.
Planned Maintenance (PM) carried out on failing assets
This is a classic scenario that is often the case in some operations.
You can see a PM activity that may have been instigated some years ago and 'developed' over years into a massive weight around the maintenance function.
These if allowed to grow over time add more PMs, this strains already stretched labour resources on equipment that still breaks down.
Why would you do this? Would you do it with your car? Another sure sign of a reactive process.
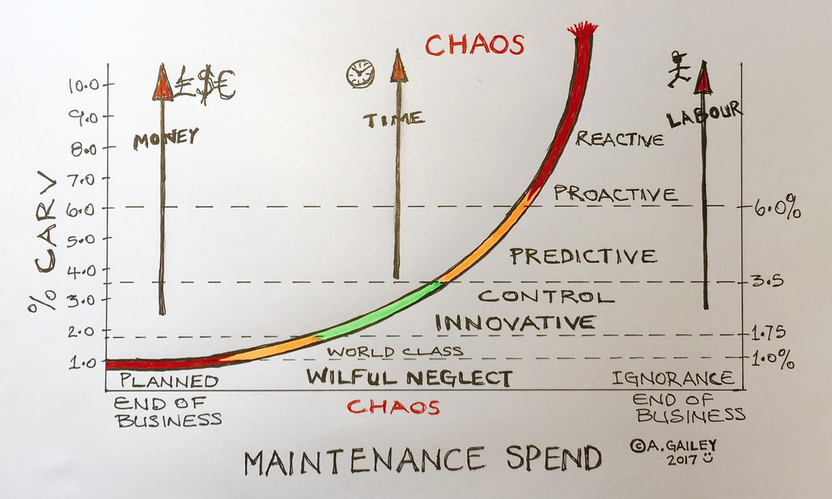
It's important to know your spend on asset care and maintenance, the above sketch is one I produced when talking to a client about Maintenance cost as % of their CARV (Capital Asset Replacement Value) you can read the full article here: https://www.linkedin.com/pulse/maintenance-spend-conundrum-andy-gailey
Reactive Labour and Firefighting
First place to look for a Reactive culture is the recorded Planned to Reactive Maintenance and repairs that are being carried out.
In the highest reactive operations whole crews of engineers or technicians will be allocated to reactive work.
Like a travelling SWAT team jumping from one catastrophic failure to the next.
These guys are sometimes so overstretched they 'band aid' equipment, only to revisit it later.
In the worst case scenarios they can't make time to record what they have done in the first place.
Another reactive tailspin!
Production losses due to Downtime
If the metrics report reduced throughputs and equipment is recorded as underperforming we are on the way to reactive. If 'crossing off' production or having to constantly adjust the workflow is happening then this is a classic reactive cycle.
I always use the adage, that once lost, that time in minutes or hours you never get back, it's gone forever.
You will have to use some more time though to catch back up, or utilise that WIP stock!
Emergency orders and specials
There can be a hidden costs with operations and maintenance using 'special or emergency' work orders.
These costs can be substantial if the supplier or rebuilder has to charge emergency rates, weekend charges, night rates and couriers that charge double for out of hours service.
This activity will be due to an unplanned outage, equipment failure or parts shortage.
Hard to identify sometimes as this activity is about reacting quickly and is hiding a deficiency in the system.
Worst cases will have caches of emergency work order numbers ready to go.
Overtime work on breakdowns
If work on unplanned events is taking place and you have to ask people to work overtime to get it back on-line then you are in a reactive loop.
Ad hoc Permits To Work
Reactive work costs on average 2-5 times the same work carried out in a planned fashion; but what about the safety angle?
Reactive situations by their nature happen anytime, this can require working on assets still in operation around you with an added risk.
This will require a Risk Assessment and in some cases a PTW to carry out the repairs, these permits can sometimes take as long as the repair work.
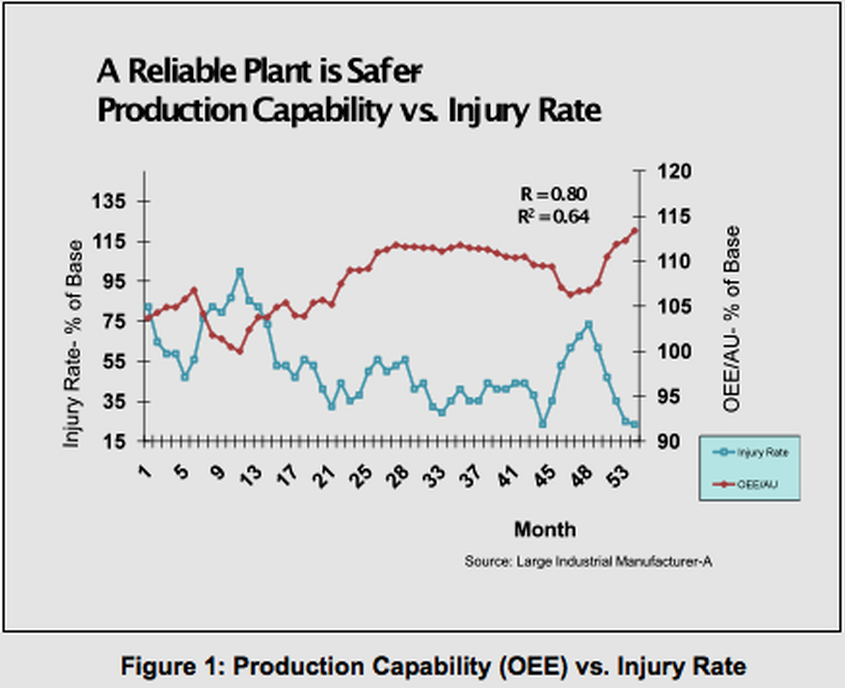
Ad hoc PTW is another sure sign of risky reactive work taking place. See the graphic below:
The above graph is from an excellent article by Rob Moore, The RM Group Inc and shows the Injury Rate in Blue against the Production Capability in Red indicating High Reliability resulting in Reduced Injury Rates
Accidents and Near Misses
Reliable operations reduce the risk of personal injury, this has been recorded in many studies.
How can we stop injuring employees or contractors? Make more reliable operations, that's how.
If the accident rate is high and the near misses are low it's a sign of a reactive culture.
Making operations safer by increasing the reliability of assets, engineering can have a major impact in the area of safety.
Disorganised Work Areas
Reactive cultures and work places encourage disorganisation.
One of the first places to visit is the 'workshop' if it's a dumping ground you have a sure sign.
Lubrication store, if there is one it's a bonus, if you can't get in for debris, empty cans, unmarked vessels, improvised funnels and jugs that's a red flag.
What about the stores, how are the expensive parts in the stock room being cared for?
How do the general work areas look?
Can you make out where to walk and where not to?
Are there any standard systems evident?
This is the quickest way to get an idea of where an operation sits on the reactive scale.
Hope that has given you something to think about.
In part two of this three part series I will look at these 10 indicators and suggest ways to move towards a Proactive phase.
In the third and final part I aim to share some top tips on how to enter the land of Predictive with a conclusion about what an Innovative operation may look like
Move towards Proactive Maintenance: Part 2 of 3
Part 2 in the trilogy of articles collectively called "From Reactive to Innovative"
Article 2 in the trilogy "From Reactive to Innovative" explores moving towards Proactive Operations & Maintenance
This second article are some aids and tips to entering Proactive, not just in Maintenance but also looking holistically at Operations.
If you missed Part 1 "Recognising the Reactive Cycle Pt.1" you can read it below this article.
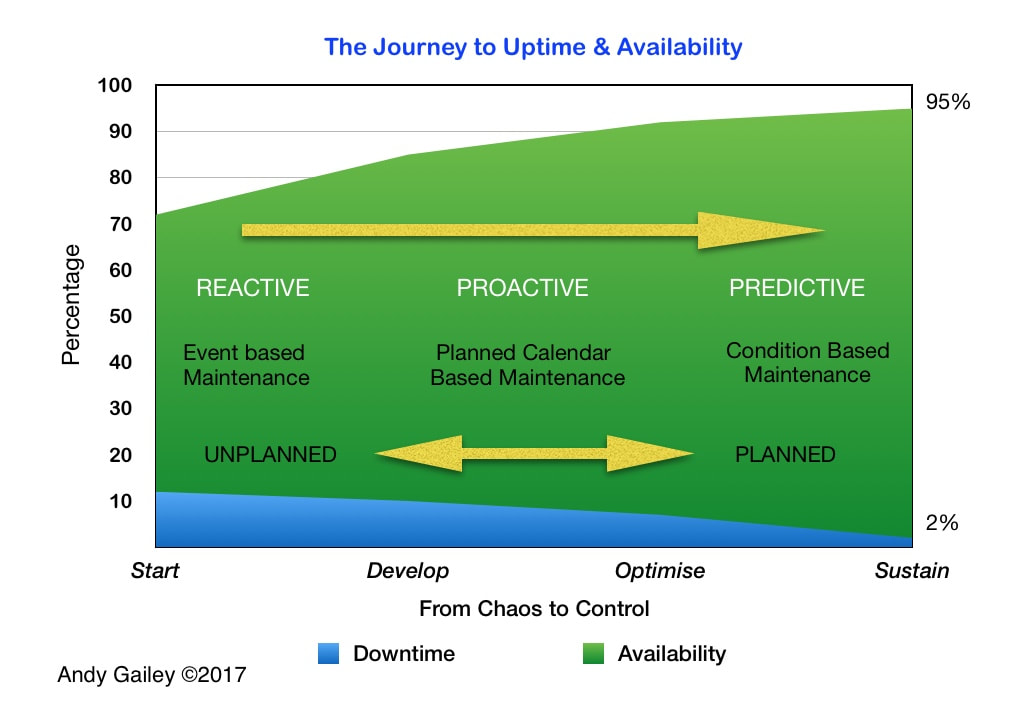
The graphic above gives a good idea of what the journey from totally Reactive to Proactive & Predictive looks like.
Reactive operations across all industries work in the Unplanned Event based Maintenance zone.
Recently I was talking with a client they had difficulty understanding how moving from their present reactive state to an optimised operation promised to deliver any benefits.
I produced this infographic that explained the journey, should they choose to embark on it.
The chaotic Reactive state portrayed on the far left moves into a phase where Proactive methods and controls are implemented, the later phase introduces Predictive techniques displacing traditional Planned Maintenance with the goal of sustainable availability on the far right.
This is when an operation can truly become Innovative.
The horizontal axis is a time line that will be dependant on the operation, the culture and starting point on the line, think here in terms of years rather than months. From my experience it's a journey that requires commitment to get to the far right hand side!
The measures I have used are realistic as I have experience of taking a similar journey before, the timespan was about four years.
The key to success is the cultural change from a Reactive "this is how it is" situation to a shared vision where the mindset becomes "it doesn't have to be this way" that leads to proactive and continuous improvement at all levels, at all levels is important as we will see later.
This journey becomes easier when chaos is left behind and Proactive planned maintenance is adopted, the trick then is to know how to move into the Predictive phase where the three cost drivers I mentioned in an earlier post are impacted.
These are the three drivers; Money, Time and Labour, they are interlinked and improved as the operation moves in the direction of the arrow to the far right.
Time to revisit the 10 indicators of a Reactive operation from Pt.1 and add some thoughts about implementing a strategy to enter the Proactive phase, you may want to refresh your memory and the original comments by referring to Part 1
Excessive WIP
WIP as stated in Pt.1 is an indicator of pre-empting a failure. Efforts must be made to reduce this reliance in a staged process.
Toyota with their approach aims for continuous 'flow', this is where the ideal is.
Not many will be able to emulate this, but it will get easier to negate WIP when the process and equipment improves its stability and reliability.
High levels of parts held in stores
If this is found then it's a key indicator of Reactive culture.
Procurement have to work closely with Maintenance and Operations to come up with a plan.
I would suggest that every newly requested part be put through a Criticality process that will decide if it is stocked at all, if so the minimum and maximum quantity and a re-order level must be set and reviewed periodically.
A tangent piece of work should identify those fast movers with reliability work targeted on the Root Cause of their repeated failures.
Planned Maintenance carried out on failing assets
A line has to be drawn with an issue like this. It will be a gradual process over many months but is worth it in the long run.
Choose the highest criticality asset that is having repeated failures; this would probably be a total line stopper, something that results in losses over the three drivers; Money, Time and Labour. Aim to bring this asset into 'as new' condition with pieces of planned work.
Don't cut corners, return the equipment to its true original state. Whilst doing this carry out a full review of the Planned Maintenance (PM) and remove PMs and Tasks that are redundant, edit Instructions to include precise details, remove all the 'Check this, check that' garbage that has been copied and pasted.
Involve Operators along with Maintenance personnel in this process, give them ownership of the assets.
The failures will recede and more time can be spent on improving equipment and betterment rather than just reacting to breakdowns.
Reactive labour and Firefighting
If there's a dedicated Reactive crew as mentioned in Pt.1 then it's time to move them into Proactive Maintenance.
This may prove painful in the short term but it has to happen to get out of the Firefighting loop, again this may take months rather than weeks.
Allocate members targets like putting that failing equipment back to 'as new' condition described in the previous paragraph.
Introduce some RCA training to get them into a mindset of 'fix once for good' instead of the 'band aid' and move on cycle. Introduce basic PdM techniques and training, add specific Lubrication training and get someone to own the PdM and Lubrication strategy.
This will need support from their managers and operations to not be tempted to drive this vicious cycle by pulling from one job to the next.
Make sure there is time allocated to recording issues and work carried out in the CMMS and other logs.
Above all communicate the changes and share the wins in Reliability instead of rewarding the best Firefighters.
Production losses due to Downtime
The Process is the key to why the business exists in the first place, but if the assets are failing and causing unplanned downtime the losses will mount up.
Some of the good work above will target some of the main offenders but we don't want to get too wrapped up with just the big stuff.
Most production losses will actually be lost with minutes here and there, they happen frequently but don't cause much 'noise' as an issue.
This is where the whole organisation should become involved to identify, measure and drive down these small incidents that cause most missed production opportunities.
Emergency orders and specials
To stop the practice of emergency work orders and special orders we first have to make them visible as they are often a hidden cost. This means taking the hit in the short term and running a RCA on every downtime event (over a trigger) that addresses the deficiency in the system.
Start by trawling the archive of these incidents and finding out why the parts weren't available, how and why did the equipment fail, is there a way of mitigating it in the future, could a Predictive Maintenance (PdM) technique have given an earlier warning?
Eventually the cycle will be broken and the costs mentioned in Pt.1 avoided.
Overtime work on breakdowns
As described in Pt.1 this is a sure fire indicator of reactive out of control. Again some of the above points will address this issue and the reliance on working overtime with additional stresses on manning can be avoided.
Ad Hoc Permits To Work
These happen when the reactive cycle is prevalent so again should be vastly reduced as the above measures kick in. This will have a positive impact on the H&S scorecard as these unplanned interventions reduce and you remove people from high risk activities.
Accidents and Near Misses
I highlighted in Pt.1 the correlation between Reliable plants and Safe operations.
I shared the graph that demonstrated this effect; the Safest operations are the most Reliable.
Engineering along with Maintenance delivers safety as one of its products.
Some people see the Engineering and Maintenance functions as just an overhead, not true, it produces one of the most important things in any workplace; safety of the employees and in most cases of the customer and general public.
Disorganised Work Areas
They say that a Genius is reflected in a disorganised desk, well I say a disorganised workspace is dangerous, counter productive, unsightly and encourages failure.
We are not in the 'genius' category here, we are looking for organisation with clean workplace systems using Lean, 5S or other such approaches.
Basically we need to remove all unwanted redundant items, clear the work areas and get them fit for purpose.
I mentioned the Part Store and Lubrication Store in the first article, these are critical spaces that should always be in control. Parts should be clean, dry and stored correctly as well as the Lubricant stocks. Up to 80% of all rotating failures are down to poor care of parts, incorrect fitting or bad lubrication practices.
Get the parts cared for, the lubrication practices correct and this will result in increased reliability and sustainability.
Hope you have enjoyed this second article making up the "From Reactive to Innovative" trilogy, the final part will conclude with Predictive to Innovation.
Proactive and Predictive to Innovative: Part 3 of 3
Part 3 in the trilogy of articles collectively called "From Reactive to Innovative"
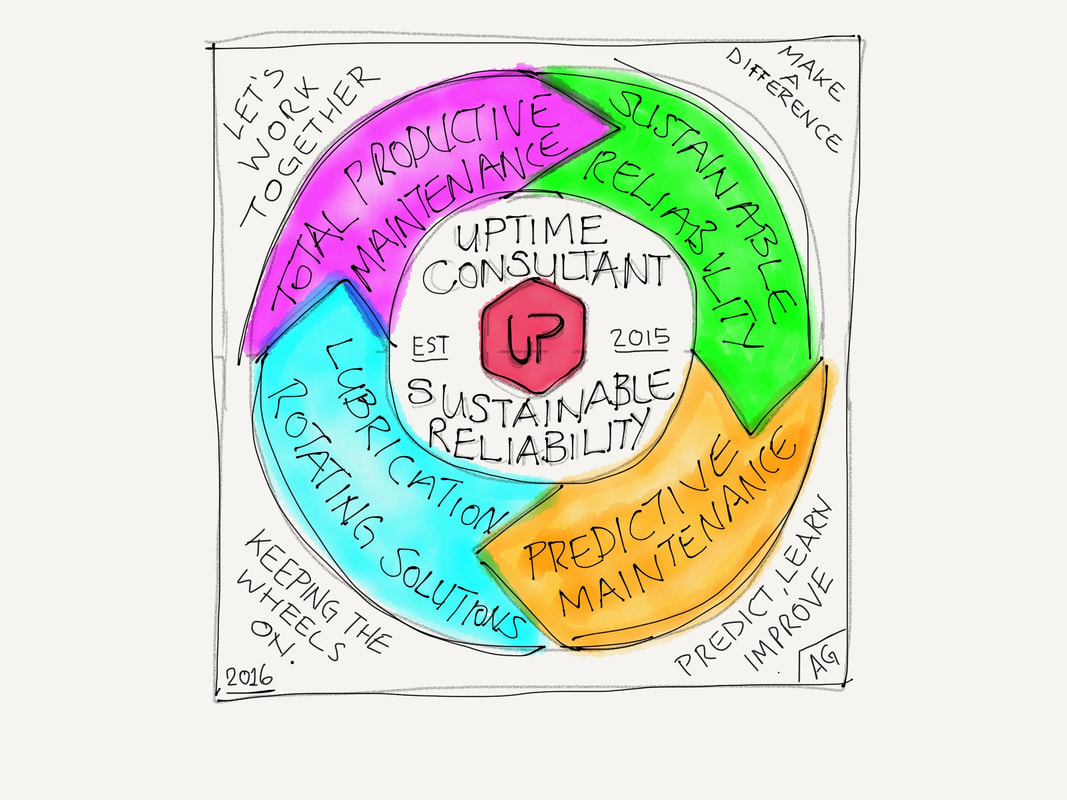
The Uptime Consultant Ltd doodle from not long after establishing the business still says it all for me ©2016
In Part 2 we looked at moving from Reactive to becoming a more Proactive organisation, in this final part of the series the journey moves to Predictive and a future state of Innovation
Before we start it would be good to take a look at what "Innovation" actually means. I found an ideal definition from the Business Dictionary that goes like this:
"To be called an innovation, an idea must be replicable at an economical cost and must satisfy a specific need. Innovation involves deliberate application of information, imagination and initiative in deriving greater or different values from resources, and includes all processes by which new ideas are generated and converted into useful products. In business, innovation often results when ideas are applied by the company in order to further satisfy the needs and expectations of the customers"
For me the key phrase to stress here is:
"replicable at an economical cost and must satisfy a specific need"
It's no use if you can't repeat your new method or idea at a high cost that has no return on investment or addresses any specific needs of your internal or external customers.
By this stage hopefully most of the key indicators in the first two articles have been addressed or are being developed. There are many more areas that will require some focus, I only chose to talk about the 10 indicators that I find are the most obvious.
To get to the next destination on our journey, Operations, Engineering and Maintenance departments will have to come together and share best practices. These functions working together can have a massive impact on production, reliability and OEE. It still seems quite strange to me that many operations and engineering departments see themselves as separate entities!
They need to adopt a shared responsibility for the Process and to achieve this they cannot act as silos within the business
In manufacturing Process and Production should be 'King' with Operations and Engineering working together towards their common goal.
The best way to approach this is through the use of a Reliability-centred Maintenance (RCM) process.
This is best carried out by a facilitator that leads the process and develops the site team to understand and carry out the methodology, it should focus on the Process and develop a Maintenance strategy that examines all of the assets to optimise the operations and maintenance program for maximum benefit.
To do this effectively Operations and Engineering have to collaborate to push the process forward, both will be winners in the long term.
A key to success is embracing the RCM process, searching out Continuous Improvement (CI) that knows no end, optimising processes whilst reducing waste streams. This process will drive out Planned Maintenance (PM) that adds little or no value and enhance the remaining tasks.
Some of these PMs will be displaced by Predictive Maintenance (PdM) techniques that are sometimes best instigated at operator level.
Involving operations personnel will give them a sense of ownership of the assets at the same time as gaining new skills that can alleviate the strain on the maintenance department, this in turn increases morale overall and fosters closer links between Operations and Engineering.
The benefits are multiple, based on my personal experiences as a front line practitioner.
I spent many years developing a successful PdM strategy that included Condition Based Maintenance (CBM), Total Productive/Proactive Maintenance (TPM) and Lubrication strategy.
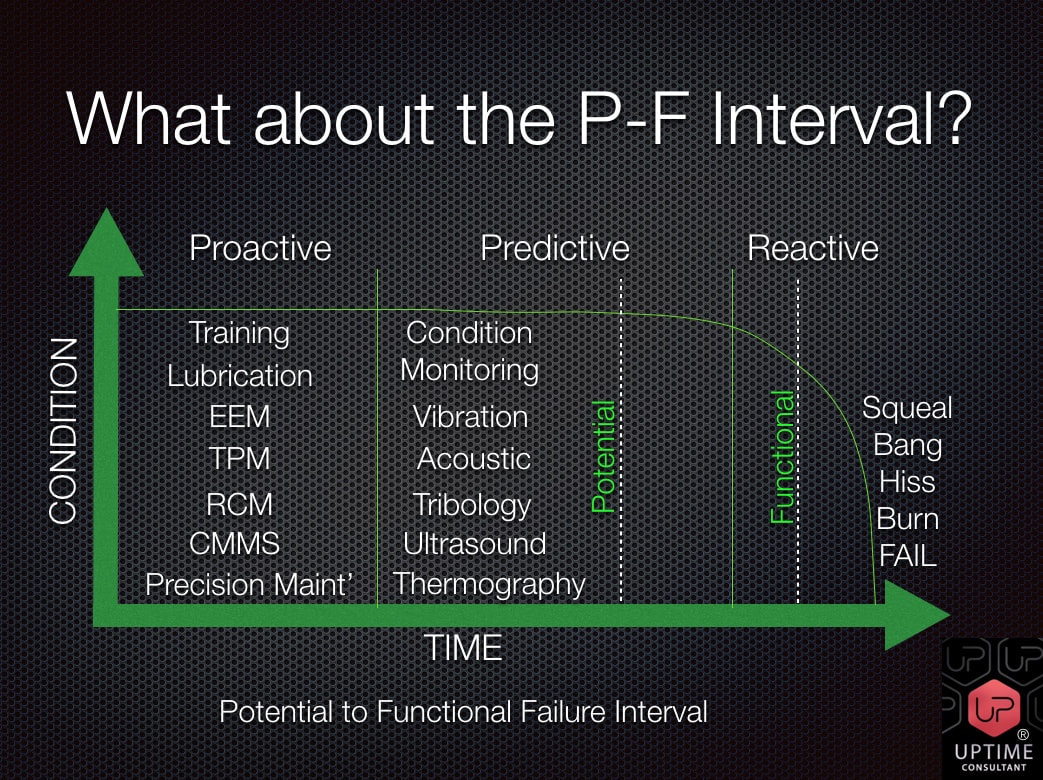
Get Predictive above with the Uptime Consultant Ltd P-F Interval infographic. Recognising the Potential to Functional interval is an important part of your PdM strategy
Root Cause Analysis (RCA) will have become normal by now with a library of experience gathered and fed back into the CMMS including history and failure modes.
Downtime and production losses will instigate the RCA process that may involve one or two individuals, or in more serious incidents a whole group from across the operation, the trick here is judging the severity of the RCA incident, you don't need a sledge hammer to crack a nut!
Continuous Improvement (CI) will involve the complete workforce, operators often see things others don't because they are so close to their equipment. This activity instils ownership of assets as they develop their trouble shooting skills, solve process issues, reduce wastes and increase equipment reliability.
Listening and talking to operators is the quickest way to getting towards an answer to repeat failures and identifying root causes in my opinion.
If I had a £, $ or € for every time an operator has said "nobody listens to me" I wouldn't have to work again or write this article!
Listening and taking on board their day to day experience is the most valuable tool at your disposal to get to root causes
By the time we have reached this part of the journey the engineers or technicians will be enhancing asset reliability through modification, improvements or new technology.
Unplanned downtime will be in low single figures, planned downtime (PMs & changeovers) will also have been reduced through process optimisation and the removal of disruptive PM tasks.
Wastes will now be at an all time low with reduced utilities use, and the safety scorecard will look a whole lot better with the morale of all staff improved beyond recognition.
Operations will have confidence in Engineering to deliver and they will reciprocate with Availability that delivers.
The Operation will be spending more time on betterment and becoming Innovative
Revisiting the infographic from Part 2 shows us that we have to START at some point, Develop into a Proactive organisation then begin to Optimise this strategy as the Availability (Green) increases and the Downtime (Blue)abates.
The really hard work is when you think the journey is over and Sustaining that level on the far right; the journey is never over by the way!
This is the way to a Sustainable business and Innovative operation
Hope you have enjoyed my trilogy "From Reactive to Innovative" let me know your thoughts, do you agree with me or see things differently?
If you like it and it has lit up the grey matter then please share this page, it may help someone else if they are in that Reactive loop I talked about in Part 1.
There's never enough space to cover all the parameters here in three short articles and there are loads of books on the approaches I have mentioned.
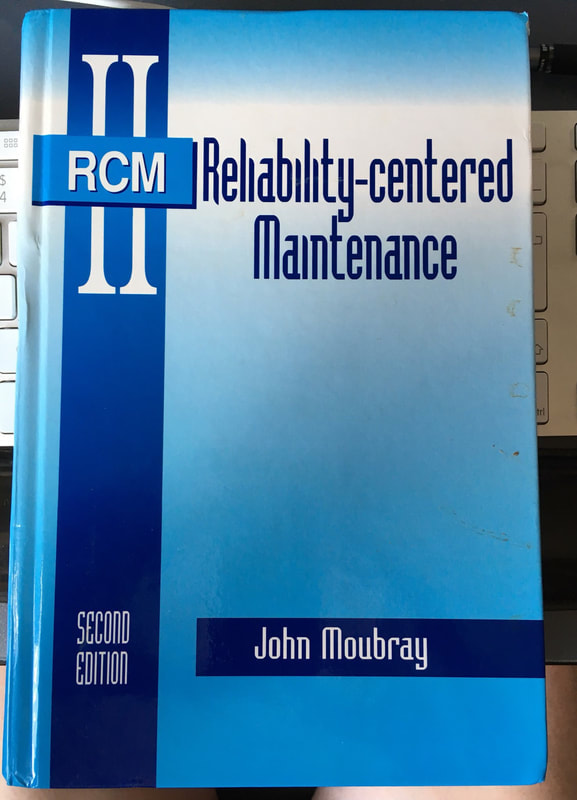
Top of that booklist for me is this one by John Moubray titled RCMII (RCM2), here is my well used second edition copy, get one if you can.
Please get in touch if you would like Uptime Consultant Ltd to help you with your journey into Productivity, PdM and Reliability
Tip of the Iceberg for Reliability Engineering
The importance of a holistic view when considering Maintenance and Reliability
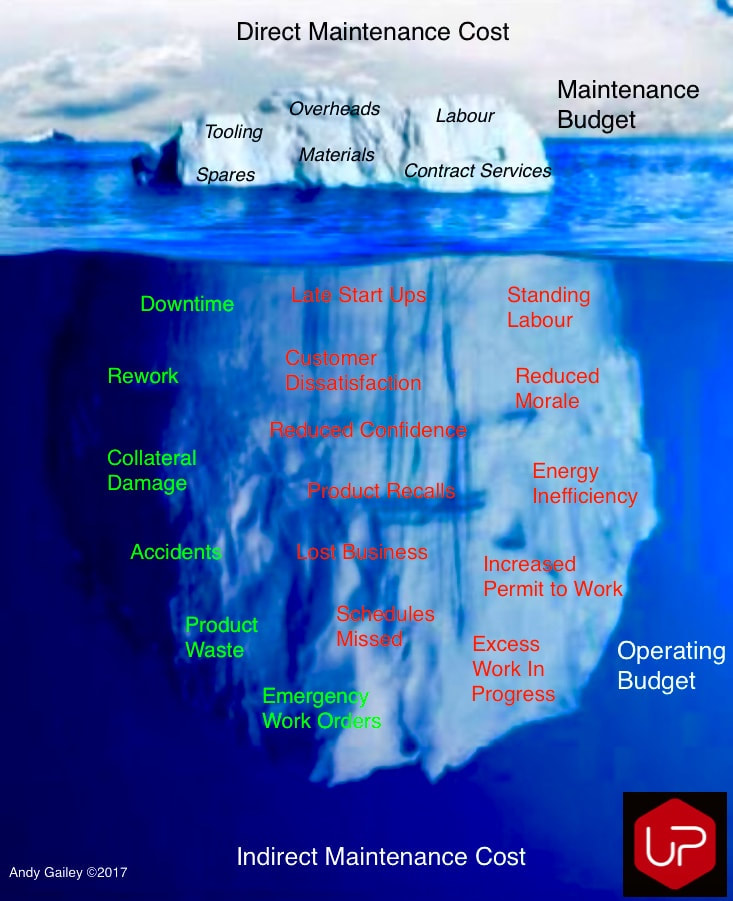
Don Nyman described this principle with an Iceberg model, modified here by Uptime Consultant Ltd
In his 2009 book "The 15 Most Common Obstacles to World Class Reliability: A Roadmap for Managers" Don Nyman explores and identifies the cultural obstacles most commonly encountered when pursuing a World Class Reliability strategy.
In the Appendices he uses this great infographic of an Iceberg describing the perceived "cost" of Maintenance as the visible berg, with the "hidden" impact on Operations as the submerged berg.
This view starts with culture and mindset, too often the Maintenance function is seen as a necessary evil or an expense to be driven down. Organisations that aspire to become World Class Reliability performers have to change this culture and mindset at the outset or they will not even get close.
I described in an earlier article about considering maintenance spend as a %CARV (Capital Asset Replacement Value) and used the analogy of purchasing a new car, we know we will have to invest money, some time and resources into maintaining its function; the trick is how much?
Maintenance in a World Class Reliability setting becomes a key driver in realising reductions in ALL waste areas, improvements in SHE, resilience of the business, increased confidence and morale amongst the many other attributes.
Operations and Maintenance working together in harmony as partners, concentrated on the Process and not just their own sphere is the only way forward. Then we can melt this Iceberg theory to become a World Class Reliability organisation, the opportunities are huge if you are moving from a totally reactive position.
The Journey from Chaos to Control
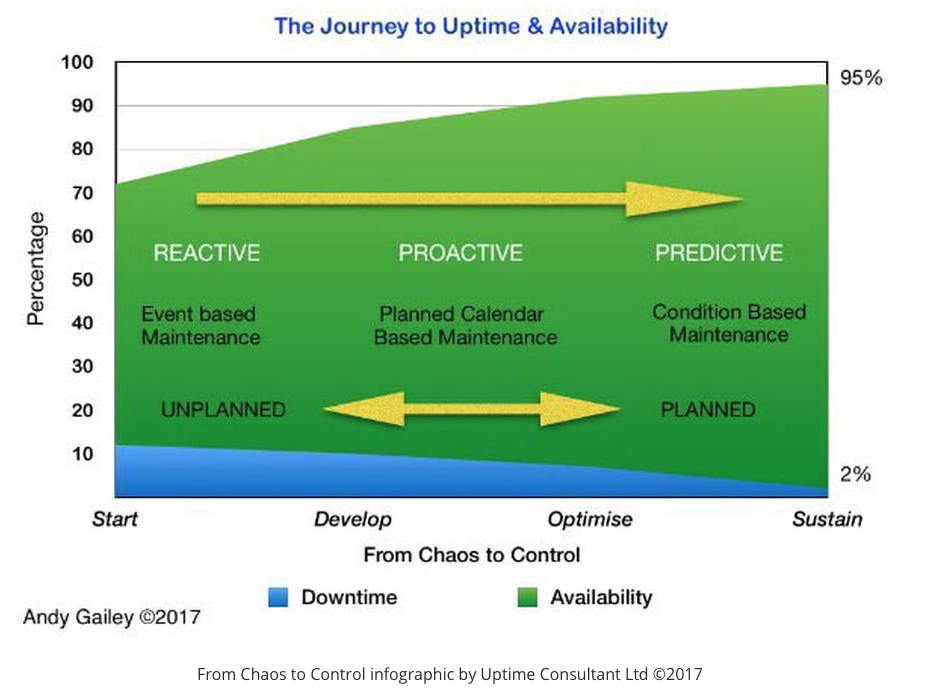
Talking to a prospective client I produced this infographic to describe the vision
Talking with a prospective client recently and they were having difficulty understanding how moving from their present state to an optimised and sustainable operation looked, so I came up with this infographic that explains the journey (should they wish to embark on it) to that controlled future state.
It portrays a chaotic Reactive state at the Start on the far left, moves to a development phase where Proactive methods and controls are implemented, through to an Optimisation phase with Predictive techniques replacing traditional Planned Maintenance with the goal of Sustainable Uptime and Availability on the far right.
The horizontal axis is a time line that will be flexible dependant on the operation, culture and the starting point along the line, think in terms of years rather than months; from experience it's a long term commitment to get to the far right hand side! The measures I have used are realistic as I have experience of taking a similar journey before; in that case the timespan was approximately four years.
The key to success (and sometimes a hurdle) is the culture change from a Reactive "this is how it is" situation to a vision of control where the mindset becomes "we can make this better" through proactive continuous improvement at all levels.
The journey becomes easier when total chaos is left behind and Proactive planned maintenance is achieved, the trick is to know how to move on into the Predictive phase where the three cost drivers I mentioned in an earlier post are impacted. These are your three drivers; Revenue, Time and Labour, all three of these are interlinked and improved as the operation moves in the direction of the arrow to the far right.
There will be measures, controls, training and techniques that are implemented and developed at each stage of the journey, these will all depend on the industry sector, environmental and regulatory requirements.
Where do you think your production plant or organisation sits on the graph? In the Reactive phase, somewhere in the Proactive or at the Predictive and in control phase? Do you know exactly where you are; have you started your journey or are you waiting for the 'right' time?
The sooner you start your journey the sooner you will arrive at your destination of Control with minimal unplanned downtime and maximum asset availability.
Engineering Maintenance Spend by %CARV?
What should we consider when evaluating our Engineering spend?
- Do we know the true cost and benefits of Maintenance?
- Is it measured against a benchmark figure?
- Is Reliability and Productivity enhanced with increased maintenance spend?
Some basic questions all Engineering and Maintenance managers will have asked themselves at some point.
A decision then has to be made on how to contain or cut the costs without impacting Reliability and Productivity. I say cut or contain as a lot of organisations may see this budget as an overhead they would rather be without... a necessary evil!
For me the two key elements the Engineering and Maintenance function should impact positively are Reliability and Productivity. If you can get these two aligned into a plan with the buy in from Operations the strain on resources will reduce. All businesses are constrained by three major resources; Money, Time and Labour.
If the Maintenance function is innovative and in control it will positively impact all three of these boosting Reliability, Productivity and OEE.
So where to start?
The best measure I have experience of working with in a fast moving production environment is to express engineering spend as a percentage of CARV (Capital Asset Replacement Value) often referred to as RAV (Replacement Asset Value), I think CARV is more descriptive so I will stick with that.
The first piece of work is to get a total CARV figure, this should be a valuation of the complete facility not just the assets that sit on the floor, it wouldn't include the real estate value or normal site services, but would include infrastructure included in the maintenance spend. This figure may be available from capital expenditure accounts or insurance cover values, don't sweat the figure too much as it's a moving target that may be hard to define exactly.
A 10% difference may be acceptable, in the near term you are after realising a figure to benchmark against for future improvements. If new lines or major installations are added though remember to update that CARV figure as it will skew your maintenance budget target.
So how should we think about what we spend on maintaining our production facilities so they fulfil their function?
The analogy I like to use is buying a new car.
Imagine you've just spent £25,000 on that new car and at handover I said it will cost 10% per annum to maintain it, you would be slightly perplexed now having to find another £2,500 a year to keep it on the road!
If however I said it would cost only 1% in fixed maintenance that would be easier to live with at £250; in fact this is a typical level of %CARV for maintaining a family type vehicle, 1-1.5% is the norm.
So why in manufacturing do we see figures approaching or exceeding that 10% unthinkable cost?
Of course we could just ignore the planned maintenance and invest nothing but this would almost certainly lead to reliability issues in the future.
Logical thinking says I am "comfortable" with 1-3% but the 10% would be a nightmare scenario!
Conversely if I choose to spend four times the recommended maintenance cost of £250 and spent £1,000 instead would this increase the reliability? No it wouldn't, all it would do is reduce the availability because it would be in the service centre four times instead of once per annum; and my %CARV is now 4%!
So bearing this in mind there should be a distribution point where we see optimum reliability and availability at a point between one and ten percent of CARV. Fortunately decades of information of benchmarking in different industries has been recorded and their figures usually sit between 1-5% of CARV.
The main thing to have in mind is that if you are just starting, you need to know where you are, and where you aim to be in one to five years, with a plan to support your strategy.
Some will say this doesn't fit all industries, and I would agree, but in the FMCG and Food sectors I am involved with it's a tried and tested methodology. It's also useful when considering similar production facilities across a group business; the outputs also foster comparison and sharing of best practice across the Engineering and Operations functions of the different business units.
Benchmarking over the decades has produced a robust set of figures that shows there is a "sweet spot" that sits around the 1.75-2.5% measure where that optimum level exists; if you are already at this level well done you are working at one of the most innovative production facilities, it will have taken a lot of hard work to achieve that level and constant vigilance to not slip off the edge.
If you are at the 1% level then you are in the less than one percent of truly World Class leading businesses, or you have cut the budget so fine you are going out of business!
If however your figures comes out at 10% or more then this will prove unsustainable in the long term and I would like to bet the maintenance strategy is in a totally reactive cycle, fire fighting, stretched resources, unplanned downtime, collateral damage, unsafe working, fixing and surviving until the next catastrophic failure.
On the other hand if you are spending at the double figure level and not reactive, then revenue, time and labour are all being wasted; again not good in the long term.
So how do we go about driving the costs down into control and maintenance optimised?
As I pointed out earlier the only way to successfully reduce %CARV spend and optimise is to focus on Reliability and Productivity measures working along with the Operations Department.
RELIABILITY: you will need to focus on the Culture, Knowledge and Skills of the different functions.
Mindsets will have to change from Reactive to Proactive then Predictive.
Total Productive Maintenance (TPM), Reliability-centred Maintenance (RCM), Criticality, FMECA, Continuous Improvement and Training in all the above.
PRODUCTIVITY: when I think about this I always think about wastes.
Wastes of Time, Money and Labour; the key is to remove wasted time, thereby reducing spend at the same time as saving labour.
Planning, Preparation, Scheduling, Spares Inventory, Predictive Maintenance (PdM), Condition Based Maintenance (CBM), Root Cause Analysis (RCA) with a close relationship with Operations.
Investing in training your people is key, foster ownership with operators, give them the basic skills to engage in TPM, release the maintenance staff to work on improvements, listen to their input and experience, change the culture from fire fighting to proactive then predictive.
Eventually you can introduce RCA triggers to eliminate major outages and repeated failures, look for Continuous Improvement opportunities, get spares inventory under control thereby reducing levels, remove intrusive planned maintenance whilst providing the right skills, with the correct spares in a controlled schedule.
Above all staying safe whilst working in a controlled fashion.
My personal experience would advise to start with Reliability closely followed by Productivity improvements, it's a journey that will last years and months, there are no overnight fixes.
All journeys have to start somewhere, the sooner you start the sooner you will arrive at your destination.
Dr W. Edwards Deming
If you haven't heard of W. Edwards Deming then here is a good place to start.
This is the man that influenced Japanese industry post second world war into making Japan the second largest economy in the world
He made a significant contribution to Japan becoming renowned for innovation and quality at low cost
This is the man that influenced Japanese industry post second world war into making Japan the second largest economy in the world
He made a significant contribution to Japan becoming renowned for innovation and quality at low cost

